Blog Posts Tagged with Moving Averages
Here's Why I Track the Percentage of Stocks Above Their 50-Day Moving Averages
If you've visited the General Market Overview page or watched my Chart Notes page for a while you've seen the % of Stocks Above Their 50-Day Moving Averages indicator.
Read More ➞A (Possibly) Disturbing Divergence on the General Market Overview Page
I've been noticing this while reviewing the Genreal Market Overview page for several days now and wanted to highlight it. I've written several times about how I use the "Percent of Stocks Above their 50-Day Moving Averages" (similar to Worden's T2108 indicator) as an overbought / oversold indicator. And I like it much better to signal oversold than overbought.
Read More ➞New Scan: Trends in Multiple Timeframes
I just added another new scan thanks to Rick, who pointed out to me that this functionality was missing. As I told him, I guess I was too close to the forest to see the trees. I should have had this scan a long time ago, given that I've had the trend tables on the stocks since day one. So this scan allows you to find stocks based on what appears in the trend table on the individual stock pages. For example, BERY, which yesterday had this trend table:

- Long-Term Trend: Up
- Intermediate-Term Trend: Up
- Short-Term Trend: Down
How to Get a Read on the Market
As a long time CANSLIM fan, I'm a firm believer in the importance of the 'M' part of that acronym - "Market Direction". According to IBD:
if the overall market is in a downtrend, it will be very hard for even the best stocks to move higher. That's because 3 of 4 stocks move in the same direction as the general market, either up or down.
(The "general market" refers to the major indexes, primarily the Nasdaq Composite, S&P 500 and Dow Jones Industrial Average.)
Simply put: If you buy a stock when the market is in a strong uptrend, you have a 75% chance of being right. But if you buy when the market is in a downtrend, you have a 75% chance of being wrong.
It's critical to me to have a read on what the broad market is doing. I used to use IBD's 'Big Picture' to get my market read but I find that I can reach the same conclusions using my General Market Analysis page. I've written before about how I use the General Market Overview page to get a read on the market as a whole. Last week I pointed out in my notes last week how choppy & trendless the market was looking. I want to go a little deeper into what it's telling me today.
Here's the trend table for the indices from today's General Market Analysis page: 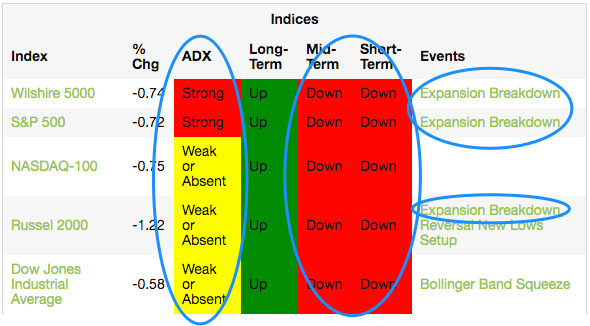
How I Use SwingTradeBot
I created this site to help me manage and speed up my nightly stock research. Here I'll share how I'm currently using the site as a way to help others see how everything here ties together. My process consists of a few general categories:
- Analyzing the broad market
- Finding new trading candidates
- Managing positions that I currently hold
- Managing / monitoring my watchlist
Popular Now
Recent Comments
- TraderMike on BOOT
- Dr_Duru on BOOT
- TraderMike on Stochastic Reached Oversold
- SuccessfulGrasshopper897 on Stochastic Reached Oversold
- Cos3 on Adding float as advanced filter criteria?
From the Blog
Blog Tags
Featured Articles